
|
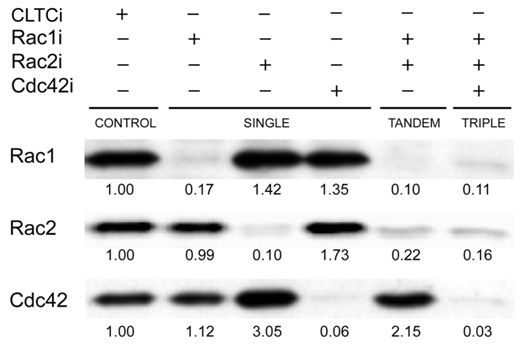
| Figure 3. Immunoblot of lysates from sorted SupT1 cells, expressing specific RNAi as indicated. Each row represents blot stained with antibody as indicated in the left margin. Figures below band are protein quantities, normalized for actin content (not shown) and relative to CLTC RNAi control. The results shown are representative of three independent experiments. |
|
|